
Average questions look like the easiest thing on a maths paper and quietly take marks from strong students. Nearly all of them rest on one idea: an average is a total shared out equally, so a mean can always be turned back into a total. Once a student does that automatically, the awkward variants — adding a value, combining two classes, hitting a target score — stop being separate question types.
An average is a shared-out total, and that is the whole trick
Every student knows mean = total ÷ count. Far fewer use the version that actually solves problems:
total = mean × count
This matters because of a rule that has no exceptions: you can never combine means directly, but you can always combine totals. Almost every average question that defeats a student is one where they tried to add, subtract or average the means themselves instead of restoring each one to a total first.
Take a standard example. The average of five numbers is 12. A sixth number is added and the new average is 13. What is the sixth number? Restore both totals: five numbers averaging 12 total 60, six numbers averaging 13 total 78. The sixth number is 18. No algebra, no equation to set up, two multiplications and a subtraction.
There is a faster route worth understanding as well. Adding a value that sits above the current mean pulls the mean up, and the size of the pull is the excess shared among the new count. Here 18 exceeds the old mean of 12 by 6, and 6 shared among the six numbers raises the mean by exactly 1. Students who see averages this way can often answer the question in their head and use the totals method as a check — useful in a 90-minute paper where the later questions deserve more of the clock.
Worth noting on tactics: AMO is reported not to deduct marks for a wrong answer, though the marking scheme should be confirmed on the official AMO pages, and awards are ranked within each grade level rather than measured against a fixed pass mark, as our explainer on how AMO scoring works sets out. An average question you cannot fully resolve still deserves your most reasonable number. The mean of a data set must always lie between its smallest and largest values, which usually narrows a guess to a sensible range.
The five moves that cover most average questions
Rather than memorising question types, learn the moves. Nearly everything in this strand is one of these, or two of them stacked.
| Move | What you do | Worked shape | The usual trap |
|---|---|---|---|
| Restore the total | total = mean × count | mean 12 over 5 values → total 60 | trying to combine means without converting them first |
| Add or remove a value | adjust the total and the count, then divide again | total 60 + 18 = 78, over 6 values → mean 13 | changing the total but forgetting the count also changed |
| Reach a target average | required total − current total | need mean 90 over 5 tests = 450; four tests total 352 → need 98 | answering with the needed average instead of the needed score |
| Combine groups (weighted mean) | add the group totals, divide by the combined count | see the worked example below | taking the mean of the two means |
| Use the structure of the set | for evenly spaced numbers, mean = middle term = (first + last) ÷ 2 | mean of 11 to 19 is 15 | applying the shortcut to a set that is not evenly spaced |
That last row is the one students under-use. For any run of consecutive integers, or any evenly spaced list, the mean sits exactly at the centre — so the mean of every whole number from 11 to 19 is 15, found by inspection rather than by adding nine numbers. The trap is equally sharp: the moment the spacing is uneven, the shortcut is simply false, and a student who reaches for it out of habit will produce a confident wrong answer.
Weighted means: group size is the weight
This is the highest-value idea in the strand and the one most often mishandled. Class A has 20 students with a mean score of 70. Class B has 30 students with a mean of 80. What is the mean across both classes?
The instinctive answer is 75. It is wrong, and the reason is that Class B contains more students, so its mean carries more weight. Restore the totals: 20 × 70 = 1400 and 30 × 80 = 2400, giving 3800 across 50 students, so the combined mean is 76.
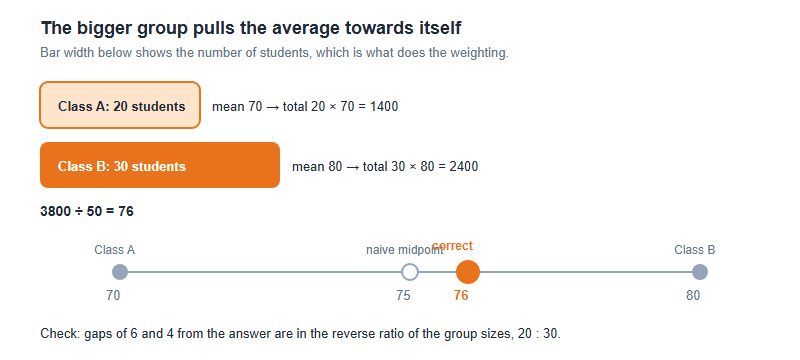
Two checks follow from the picture, and both are fast enough to use under time pressure. First, a combined mean must always lie between the two group means — an answer of 68 or 84 here is impossible. Second, it must sit nearer the larger group, so with more students in Class B the answer had to be above 75 before any arithmetic was done.
The relationship also runs backwards, and this is the version that unlocks harder questions. The gaps from the combined mean are in the reverse ratio of the group sizes: 76 is 6 above Class A and 4 below Class B, and 6 : 4 reverses to give sizes in the ratio 4 : 6, that is 2 : 3, which is exactly 20 : 30. So a question that tells you the two group means and the combined mean has already told you the ratio of the group sizes. Students who spot this stop setting up simultaneous equations for a question that takes one line.
The same weighting logic explains a trap in a different strand entirely. Average speed on a round trip is a time-weighted mean of the speeds, which is why driving out at 60 km/h and back at 30 km/h over the same distance gives 40 km/h rather than 45 — the slow leg takes longer, so it weighs more. It is one idea wearing two costumes.
Mean, median, mode and range: which one actually moved
A common question style changes one value in a data set and asks which measure is affected. You can answer it without recalculating anything if you know how each measure responds.
- Mean uses every value, so any change to any value moves it.
- Median depends on position after ordering, so changing an extreme value usually leaves it untouched.
- Mode depends only on which value repeats most, so it moves rarely.
- Range depends only on the largest and smallest, so it is completely insensitive to the middle of the set and hyper-sensitive to the ends.
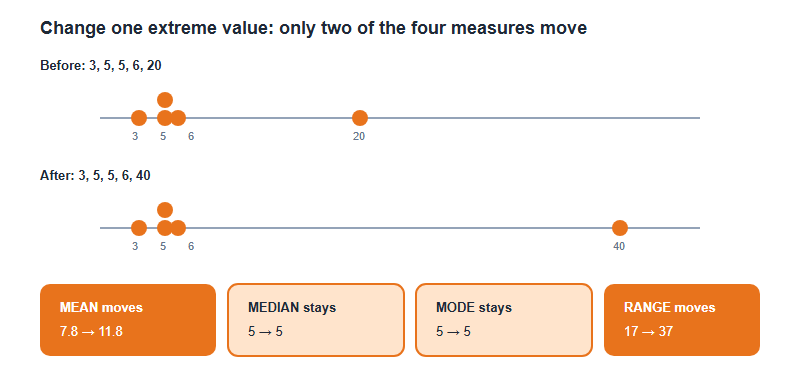
Two procedural points cost more marks than the concepts do. Order the list before taking a median — reading the middle of an unordered list is the single most common lost mark in this topic. And for a set with an even number of values, the median is the mean of the two middle values, which means the median need not be a member of the set at all. A set can also have no mode, or several, and a question that says “the mode” is quietly telling you something about the data.
Chart and table questions: reading fast without reading wrong
Data-handling questions rarely fail on the arithmetic. They fail in the first four seconds, when a student reads a value off a chart without checking how the chart is built. Four traps account for most of it.
The scale interval. Gridlines are not always worth one unit. If each gridline represents 5, a bar reaching two lines above 20 is 30, not 22. Read the axis label, the units and the interval before reading any bar.
The pictogram key. One symbol frequently stands for 4, 5 or 10 items, and half symbols count for half. A row of three and a half symbols at 4 each is 14.
An axis that does not start at zero. When the vertical axis begins at 40, a bar that looks twice as tall as its neighbour is nothing of the sort. The picture exaggerates; the numbers do not.
“How many more” against “how many times”. The first is a subtraction, the second a division, and the two words sit one letter apart in a hurried reading. Underline the phrase before you calculate.
The habit worth drilling is a fixed three-second opening routine on any chart: read the title, read the axis units, read the scale interval — then look at the data. Students who do this stop making the errors above almost entirely, and the routine costs less time than one re-read.
A practical note on where this strand sits. Simple averages and straightforward pictograms belong comfortably in the primary band; weighted means, the reverse-ratio shortcut and multi-step chart questions belong in the middle and senior bands. Our summary of the AMO grade levels shows how the grade levels are organised, and our introduction to AMO covers the contest itself — a 90-minute paper per level run by SIMCC with Southern Illinois University, and not the AMC run by the MAA in the United States. The emphasis given to any strand is decided by the organiser each season, so treat the balance above as preparation guidance and confirm the current syllabus on the official AMO pages.
Frequently asked questions
Can I take the average of two averages?
Only if the groups are the same size. Otherwise turn each mean back into a total, add the totals, then divide by the combined count.
Why does one very large value barely move the median?
The median depends on position, not size. One extreme value changes the total, so the mean shifts, but the middle value usually stays put.
Do the numbers have to be ordered before finding the median?
Always. Reading the middle of an unordered list is the most common lost mark in this topic, and ordering takes seconds.
What should a student check first on a bar chart or pictogram?
The scale. Read the axis units and the interval between gridlines, or the pictogram key, before reading any value at all.
This site is operated by Hanlin Education as an authorized AMO registration partner for China. AMO is run by the Singapore International Mastery Contests Centre (SIMCC) together with Southern Illinois University; we are not the organiser, and AMO is not the American Mathematics Competitions (AMC) run by the MAA in the United States. Dates, fees, eligibility, paper format and award bands are set by the organiser — always confirm current details on the official SIMCC / AMO pages. Worked examples above are illustrative and written for this guide. If you spot an error in this article, tell us and we will correct it within 7 working days.